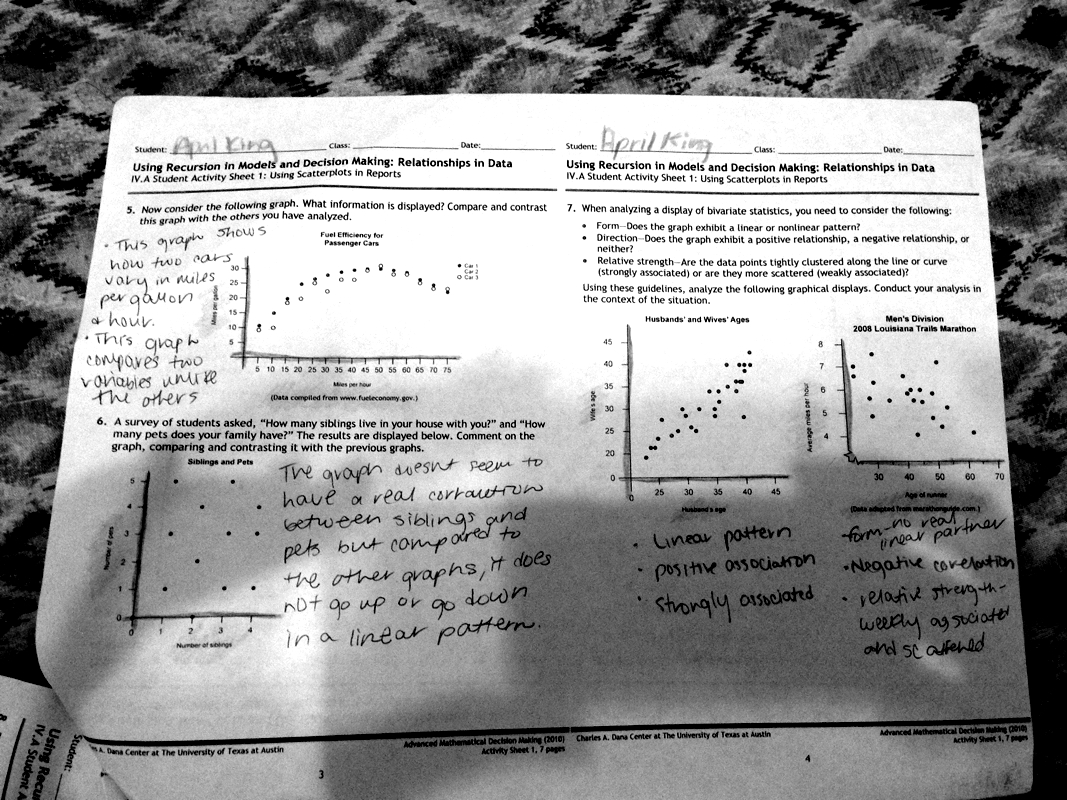
This worksheet is basically about describing the relationships in Data.. This sheet shows a lot of scatter plots an we ended up describing each one of them. When doing this worksheet I've learned that scatter plots can show negative and positive associations, as we'll as linear patterns. Example: if you look at number four it asks to compare and contrast the two graphs. For the first graph it would be considered a negative association because the lesser the children people have the more taxes they pay an I also learned that for the second graph it would also be considered a negative association because the lesser the children the more you pay, the more kids the less you pay!
 RSS Feed